Danielle Groeneweg

Supply & Demand in our Current Market for the United States.


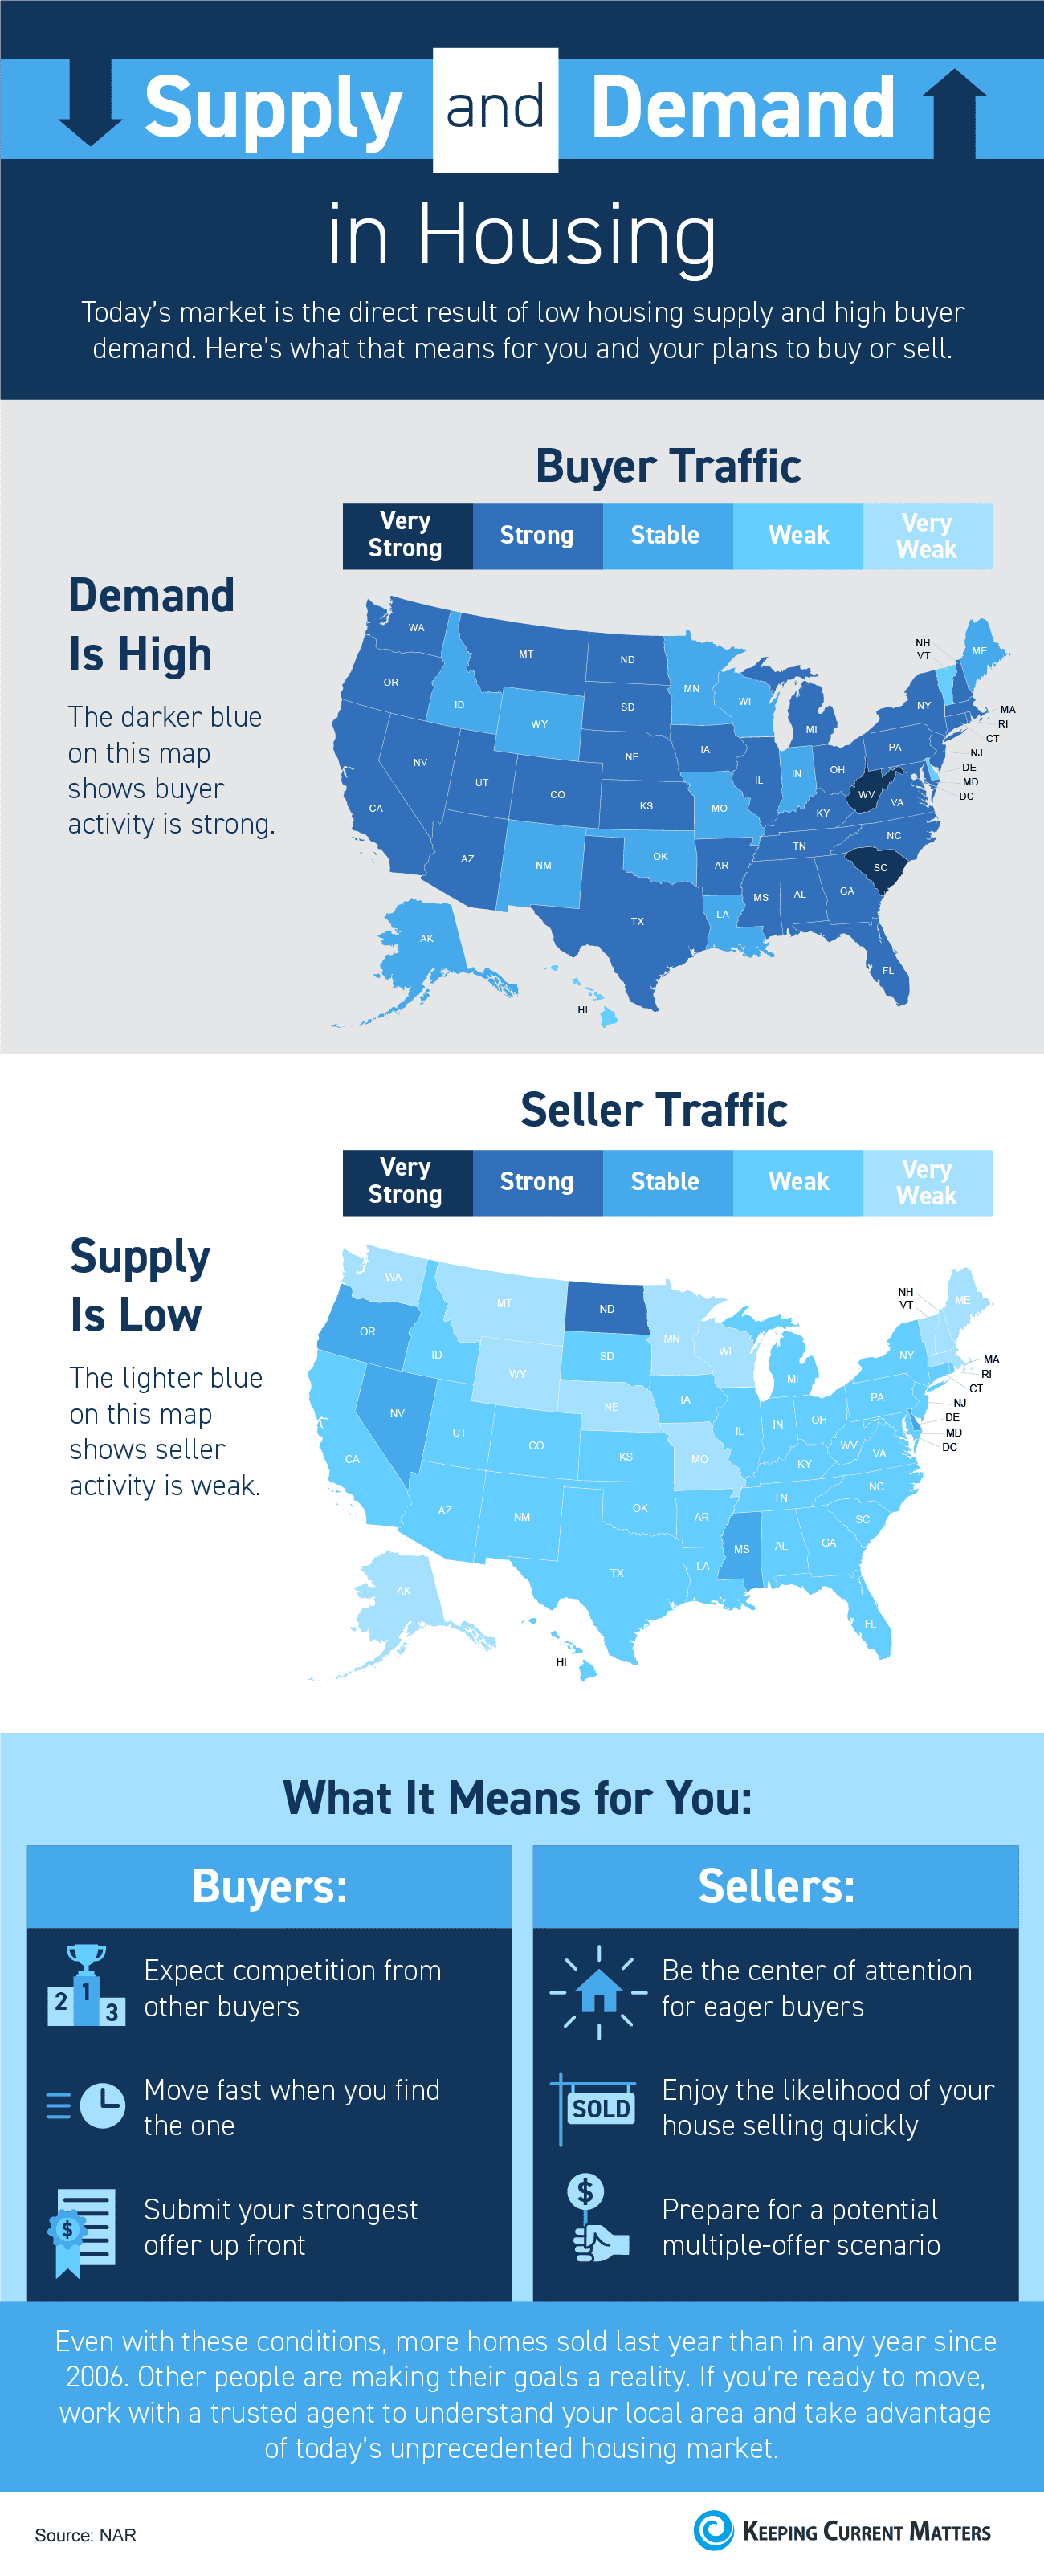
Love this infographic from Keeping Current Matters. If you want to see the full article click here. 

If you look at Washington you will see that we have high buyer demand in & a low seller activity. This is in line with what we’ve been seeing in Whatcom County. Most homes are going pending right away due to low inventory and plenty of buyers shopping for a home. I do think it is fun to look at what states are also following this trend vs what states are doing the opposite. Overall, most states do have a low inventory which is what we’ve been hearing from agents all over.

Anything that surprises you or that you find interesting by looking at this graphic?

Zoom Call- April 23rd at 10:30am


I just wanted to share more information about a ZOOM call I’m planning doing next Thursday. I would love to talk about the current real estate market as well as the impacts on the mortgage industry and getting a loan/preapproval as well as the effects that COVID-19 has had on how we can conduct real estate during this time. I am looking forward to discussing this topic since I’ve had so many people ask me about it.


If you’re interested and would like the invitation link please send me an email at Danielle@bellwetherrealestate.com and I will send you the link! If you have any other questions but aren’t able to attend at that time please still email me and I would love to discuss it with you when you’re available.

Lynden’s Stats from June-Dec 2016

Lynden Stats

Here are the For Sale/Pending/Solds from June -December of 2016 for the Lynden Market.

If you just compare the last two months- November to December the For Sales went down by 20%, solds were down by 34% and pendings were down by 3%. These numbers just prove that the market definitely slowed down in December. Inventory has been lower so I know buyers are having a harder time finding a home.

In my opinion, during the month of January the market seemed to pick up again. We will have to wait and see when the new numbers come out!

Let me know if you have any questions.

September 2016 Stats

Here are the monthly stats for Bellingham and Lynden for the month of September. If you would like the stats for a different town feel free to check out the Market Trends button on my homepage.

BELLINGHAM:

bham-sept


LYNDEN:

lynden-sept

I hope you enjoy these graphs and you can get a better idea of the current trends. If you have any questions, please let me know. I’m curious to see what October and November will be like with the election. Stay tuned to see!